Hands-on Wazuh Host-based Intrusion Detection System HIDS Deployment
In this article we are going to learn how to deploy a powerful HIDS called "Wazuh"
What is an intrusion detection system?
Intrusion detection systems are a set of devices or pieces of software that play a huge role in modern organizations to defend against intrusions and malicious activities.We have two major intrusion detection system categories:
- Host Based Intrusion Detection Systems (HIDS): they run on the enterprise hosts to detect host attacks
- Network Based Intrusion Detection Systems (NIDS): their role is to detect network anomalies by monitoring the inbound and outbound traffic.
The detection can be done using two intrusion detection techniques:
- Signature based detection technique: the traffic is compared against a database of signatures of known threats
- Anomaly-based intrusion technique: inspects the traffic based on the behavior of activities.
How to Deploy Wazuh HIDS?

According to its official website: https://wazuh.com
Wazuh is a free, open source and enterprise-ready security monitoring solution for threat detection, integrity monitoring, incident response and compliance. Wazuh is used to collect, aggregate, index and analyze security data, helping organizations detect intrusions, threats and behavioral anomalies.
Wazuh is used to collect, aggregate, index and analyze security data, helping organizations detect intrusions, threats and behavioral anomalies.
It contains the following components:
- Wazuh server
- Elastic Stack
- Wazuh agent
Now let's explore how to deploy it. For the demonstration i am using a Ubuntu 18.04 VM.
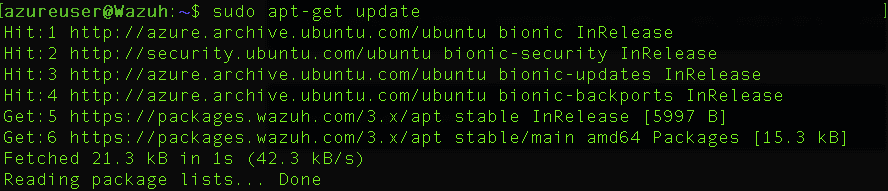
sudo apt-get update
sudo apt-get installcurl apt-transport-https lsb-release gnupg2

Install the GPG key:
wget -qO - https://artifacts.elastic.co/GPG-KEY-elasticsearch | sudo apt-key add -

Add the repository
echo "deb https://artifacts.elastic.co/packages/7.x/apt stable main" | sudo tee -a /etc/apt/sources.list.d/elastic-7.x.list

Update the package information:
sudo apt-get update
Installing the Wazuh manager

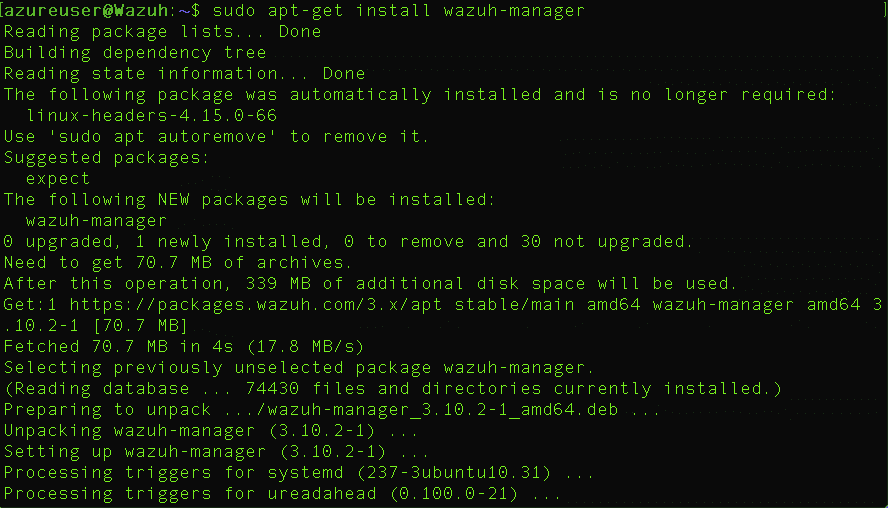
On your terminal, install the Wazuh manager:
sudo apt-get install wazuh-manager
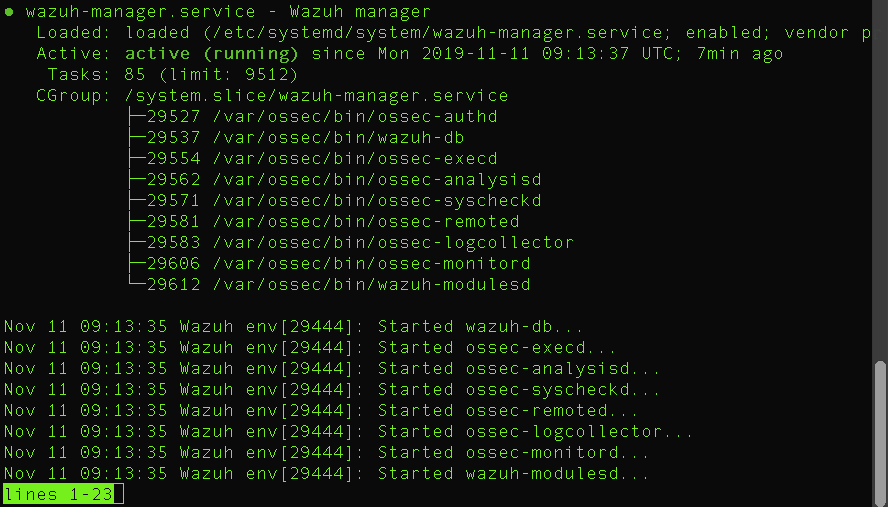
Once the process is completed, you can check the service status with:
service wazuh-manager status
Installing the Wazuh API:
NodeJS \>= 4.6.1 is required in order to run the Wazuh API.
sudo curl -sL https://deb.nodesource.com/setup_8.x | sudo bash -
and then, install NodeJS:
sudo apt-get install nodejs
Install the Wazuh API:
sudo apt-get install wazuh-api
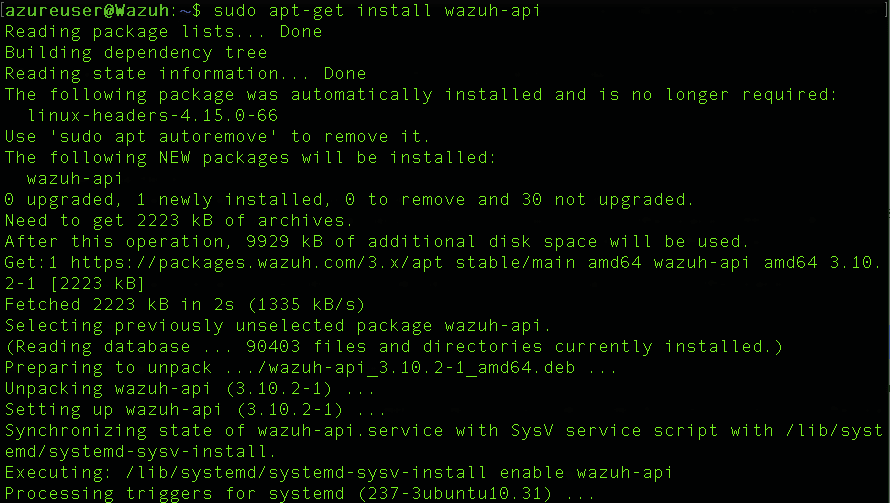
Once the process is complete, you can check the service status with:
sudo service wazuh-api status

Installing Filebeat
apt-get install filebeat=7.4.2

This is pre-configuration to forward Wazuh alerts to Elasticsearch
curl -so /etc/filebeat/filebeat.yml https://raw.githubusercontent.com/wazuh/wazuh/v3.11.4/extensions/filebeat/7.x/filebeat.yml
Download the alerts template for Elasticsearch
curl -so /etc/filebeat/wazuh-template.json https://raw.githubusercontent.com/wazuh/wazuh/v3.11.4/extensions/elasticsearch/7.x/wazuh-template.json
Download the Wazuh module for Filebeat:
curl -s https://packages.wazuh.com/3.x/filebeat/wazuh-filebeat-0.1.tar.gz | sudo tar -xvz -C /usr/share/filebeat/module

sudo vi /etc/filebeat/filebeat.yml
Enable and start the Filebeat service:
sudo update-rc.d filebeat defaults 95 10
sudo service filebeat start
Installing Elastic Stack
![]()
Elasticsearch is a powerful open source distributed, RESTful, JSON-based search engine.You can see it as a search server.It is a NoSQL database.To install elasticsearch we need to make sure that we are already installed Java.
sudo apt-get install elasticsearch=7.4.2
sudo vi /etc/elasticsearch/elasticsearch.yml
node.name: node-1
network.host: ["0.0.0.0"]
http.port: 9200
discovery.seed_hosts: []
cluster.initial_master_nodes: ["node-1"]
sudo update-rc.d elasticsearch defaults 95 10
sudo service elasticsearch start

Once Elasticsearch is up and running, it is recommended to load the Filebeat template. Run the following command where Filebeat was installed:
sudo filebeat setup --index-management -E setup.template.json.enabled=false
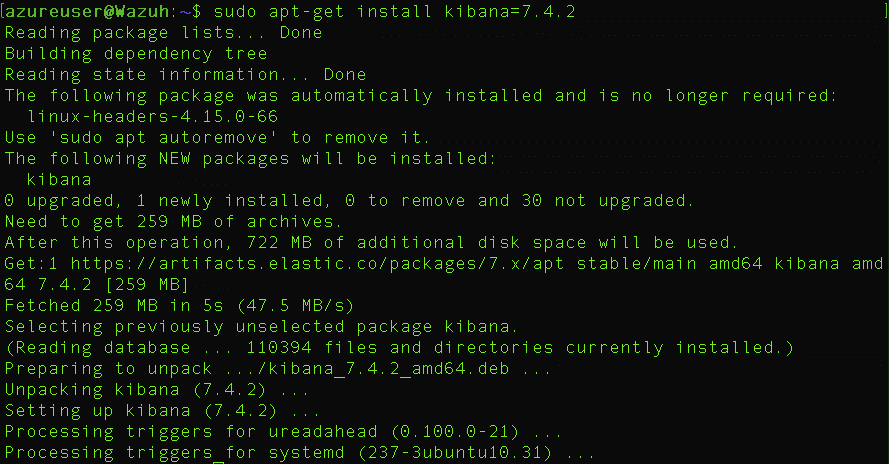
Installing Kibana

Kibana is a Web interface for searching and visualizing logs. It is a data-log dashboard. It contains pie charts, bars, heat maps, bubble charts and scatter plots. It is an amazing solution to visualize your data and detect any unusual patterns
apt-get install kibana=7.4.2
Install the Wazuh app plugin for Kibana
sudo -u kibana bin/kibana-plugin install https://packages.wazuh.com/wazuhapp/wazuhapp-3.11.4_7.6.1.zip
sudo vi /etc/kibana/kibana.yml
server.port: 5601
server.host: 0.0.0.0
elasticsearch.hosts: ["http://localhost:9200"]
sudo update-rc.d kibana defaults 95 10
service kibana start
Transform data with Logstash (Optional)

Logstash is an open source to collect,parse and transform logs.
sudo apt-get install logstash=1:7.4.2-1
sudo systemctl daemon-reload
sudo systemctl enable logstash
Download the Wazuh configuration file for Logstash
sudo systemctl restart logstash
sudo vi /etc/filebeat/filebeat.yml\</a
Configure the Filebeat instance, change the events destination from Elasticsearch instance to the Logstash instance.
Disable Elasticsearch Output:
Add:
output.logstash.hosts: ["localhost:5000"]
sudo systemctl restart filebeat
Check if Logstash is reachable from Filebeat.
sudo filebeat test output
Replace the default credentials with your desired username where myUsername is shown below to protect your Wazuh API
More information: https://documentation.wazuh.com/3.3/installation-guide/installing-elastic-stack/connect_wazuh_app.html
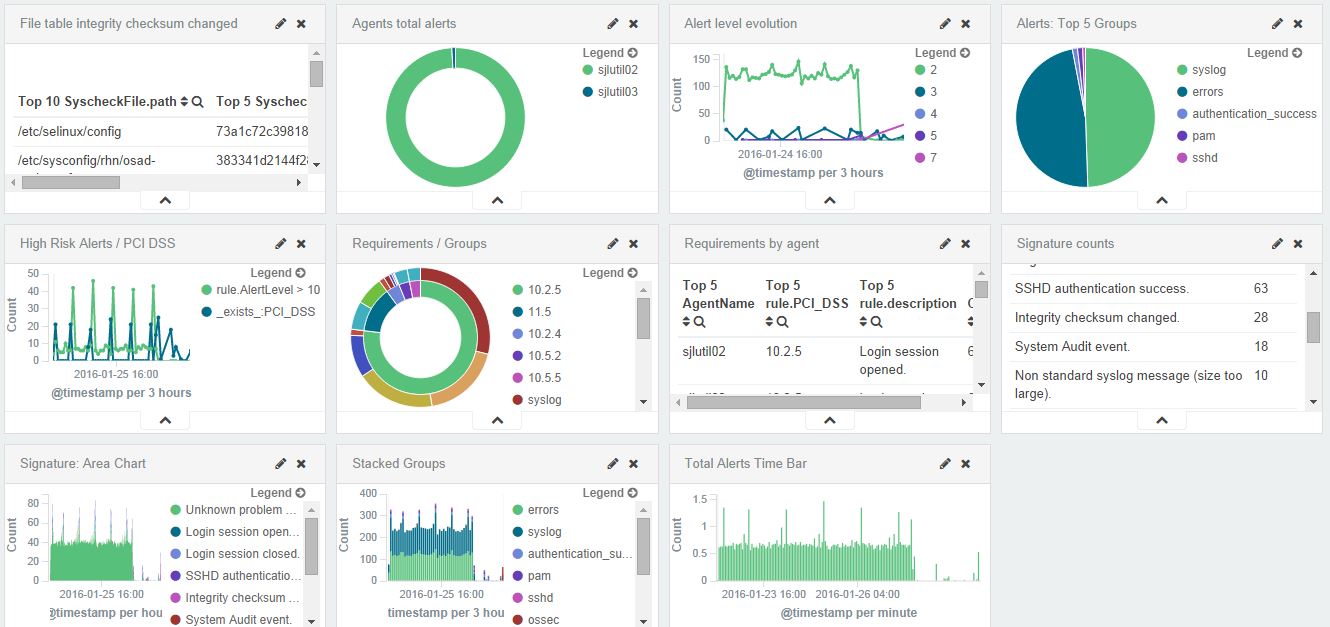
Open a web browser and go to the Elastic Stack server's IP address on port 5601 (default Kibana port). Then, from the left menu, go to the Wazuh App.
Click on "Add new API" and fill the API fields. If everything goes fine, you will get this main Wazuh dashboard.
To add new agent just select the OS, curl the package and install it: